Tetsuya “Ted” Fujita, aka “Mr. Tornado,” created the scale for ranking the severest storms.
Tetsuya “Ted” Fujita, aka “Mr. Tornado,” created the scale for ranking the severest storms.

After a tornado strikes, a team of meteorologists is called to the scene to carefully analyze clues in what’s known as a damage survey. They then rate the tornado on a six-point system referred to as the Enhanced Fujita Scale.
Its origins can be traced back to World War II, a mountaintop in Japan and the open plains of the Midwestern United States. A man who was incredibly driven and would one day become known as “Mr. Tornado” had a unique way of perceiving the weather around us and through nonstandard practices produced groundbreaking research that helped transform severe weather forecasting forever.

Tetsuya “Ted” Fujita was born on Oct. 23, 1920, in Kitakyushu City, on Japan’s Kyushu Island. Fujita was fascinated by the environment at an early age. By the age of 15, he had computed the rotation of the sun through the use of a pinhole camera, he explained in a 1988 interview for the American Meteorological Society’s Oral History Project. When a typhoon was approaching his city, he climbed onto the roof of his family house with a homemade instrument to measure wind speeds, angering his father in the process.

After Fujita explained to his father why he was on the roof with a fierce storm bearing down, Fujita recalled his father responding, “That’s a most dangerous place,” before he dragged him from the roof.
Fujita first studied mechanical engineering at the Meiji College of Technology before he turned his attention to earning his doctor of science degree at Tokyo University in 1947.
“I thought I could work on physics, but I decided to choose meteorology because at that time, meteorology was the cheapest; all you needed was paper and a color pencil. I was interested in studying the structure of a typhoon,” Fujita said in the oral history project.
Fujita’s boldness for weather observations would grow as he studied meteorology. In 1947, Fujita was offered an opportunity through the local weather service to use a mountaintop facility, which Fujita described as a small wooden cottage, to make weather observations.
Weather instruments such as anemometers and a microbarograph were inside the cottage, Fujita explained. It was the first time he would study a thunderstorm in depth. He subsequently mapped his first thunderstorm and, within several years, published a paper on thunderstorm development, and specifically noted the downward airflow within the storm, while working as a researcher at Tokyo University.
While Fujita was beginning to dive into thunderstorm research, a similar initiative was being conducted by the United States Weather Bureau (now the National Weather Service) known as the Thunderstorm Project. It was initiated and funded by Congress in 1945 as a way to examine the causes and characteristics of thunderstorms. World War II was near its end, meaning more aircraft and other needed equipment to track storms would soon be available. Dr. Horace Byers, a research professor at the University of Chicago, was tasked with leading the scientific study.
Fujita learned of the Thunderstorm Project and sent a copy of his work to Byers who found Fujita’s findings to be valuable and invited him to Chicago to work at the university as a research associate. After completing his degree at Tokyo University, Fujita came to the U.S. in 1953, telling the AMS that he figured he would work in the country for a year and then return to Japan.
Fujita recalled one of his earliest conversations with Byers to the AMS:
“What attracted Byers was that I estimated that right in the middle of a thunderstorm, we have to have a down — I didn’t say ‘downdraft,’ I said ‘downward current,’ you know, something like a 20-mph something. He said, ‘We spent millions of dollars to discover downdrafts.’ But then he asked me, ‘How much money have you spent to end up with this kind of downdraft?’ I said, ‘I made a microanalysis, and maybe I spent $100 at most.’”
Fujita did return to Japan in 1956, but not for long. He was back in Chicago by 1957. He would embark on a landmark research career in mesoscale meteorology, or the study of atmospheric phenomena on a scale smaller than entire storm systems, such as tornadoes, squall lines or thunderstorm complexes.
Fujita’s return to the United States also came just in time for him to examine one of the most notorious tornadoes in U.S. history.
When a violent tornado tore through Fargo, N. D., on June 20, 1957, killing 10 and causing widespread damage, all that was really known then was that it was a devastating twister. There was no way to quantify the storm’s damage or top wind speeds or give people a sense of how destructive it was compared to others. Public tornado warnings had only been around for several years.
That’s where Fujita came in. He arrived on the scene like a detective, studying the area for tornadic clues, all while speaking to Fargo residents and gathering hundreds of pictures and amateur footage compiled by those who had witnessed that historic tornado. Fujita used the images to then reconstruct the tornado’s life cycle from the beginning, middle and end to help paint the most accurate picture of what occurred.
His detailed analysis of the event, which was published in a 1960 paper, includes many weather terms, such as wall cloud, that are still in use today, according to the NWS.
Following years of atmospheric observations and up-close examination of different levels of tornado damage, Fujita unveiled his six-point scale in 1971. It ranked the severity of tornadoes from F0 (least intense) to F5 (most intense). With the scale then in use, the Fargo twister was retroactively rated as an F5.
Fujita’s primary goals with releasing the scale were to categorize tornadoes by their intensity and size, while also estimating a wind speed associated with the damage.
The release of the scale was a monumental development, according to Roger Wakimoto, UCLA’s vice chancellor for research and a former student of Fujita’s at the University of Chicago.
“People would just say, ‘That was a weak tornado, or that was a strong tornado,’ and that was pretty much before his scale came out, that’s how it was recorded,” Wakimoto told AccuWeather. “But now even today you say EF5, or back in Fujita’s day, F5 — people know exactly what you’re talking about.”
Once the scale became public, the “Mr. Tornado” nickname began to follow Fujita throughout meteorological circles.
The Fujita scale would solely estimate the tornado damage by the wind speeds. F0 twisters were storms that produced maximum sustained winds of 73 mph and resulted in “light” damage. An F5 twister, on the other hand, could produce maximum sustained wind speeds estimated as high as 318 mph, which would result in “incredible” damage.
The scale was important to help understand that the most dangerous tornadoes are the ones above F3 intensity and develop forecasting and warning techniques geared to those, according to Mike Smith, a retired AccuWeather senior vice president and chief innovation executive who worked as a meteorologist for 47 years.
“That allows the greatest number of lives to be saved,” said Smith, the author of the books “Warnings: The True Story of How Science Tamed the Weather” and “When the Sirens Were Silent.”
Throughout the years, it became evident that the scale had some weaknesses, including that it didn’t recognize differences in building construction. Fujita admitted that his scale could be improved and published a modified version in his 1992 book, “Memoirs of an Effort to Unlock the Master of Severe Storms.”
Fujita’s scale would remain in place until it was upgraded to the Enhanced Fujita Scale, which became operational on Feb. 1, 2007. The National Weather Service said the new scale would reflect “better examinations of tornado damage surveys so as to align wind speeds more closely with associated storm damage.”
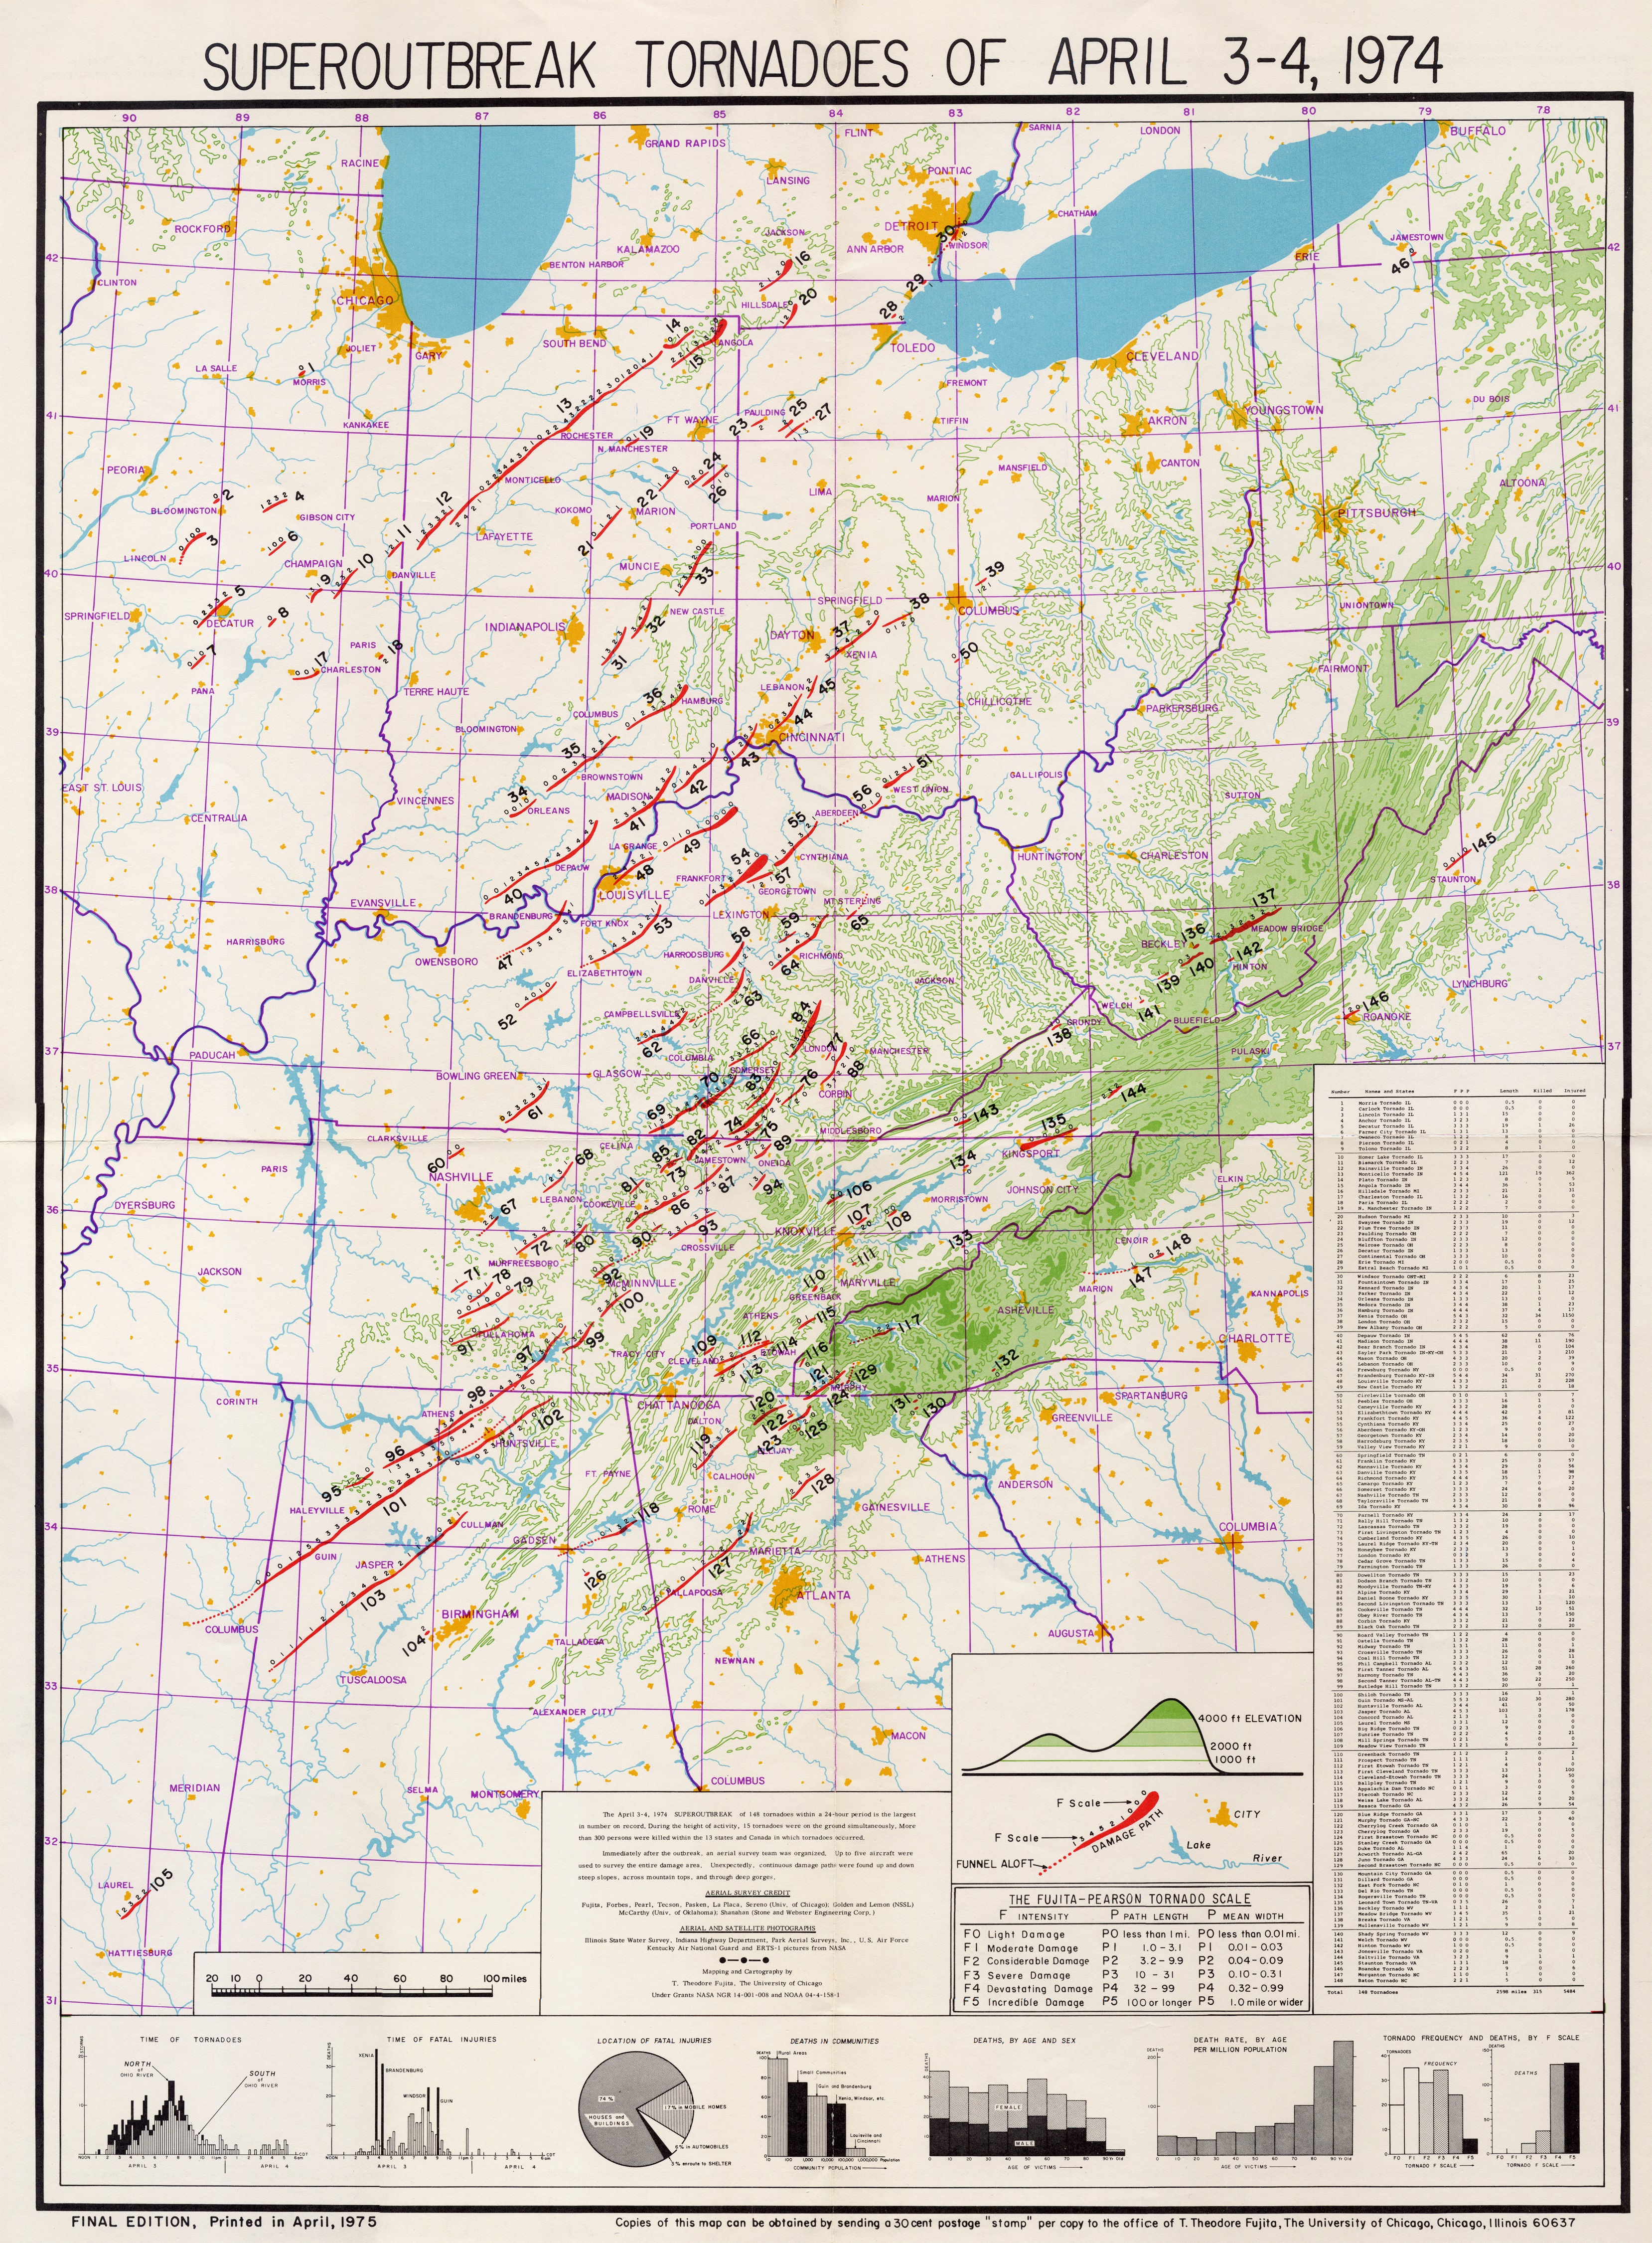
Fujita would get to put his scale to the test in the spring of 1974. On April 3-4 of that year, nearly 150 tornadoes pummeled 13 states in one of the worst severe weather outbreaks in recorded U.S. history (see graphic below). At one point, 15 tornadoes spun on the ground simultaneously, according to documentation from Fujita. More than 300 people were killed and over 6,000 suffered injuries.

Fujita and his team of researchers from the University of Chicago, along with other scientists from the National Severe Storms Laboratory and the University of Oklahoma, went on to diligently document and rate every single twister that was reported over that two-day stretch. His analysis can be read in full here.
Of the 148 tornadoes, 95 were rated F2 or stronger, and 30 were rated F4 or F5 strength.
The storm surveyors of 2021 use an abundance of technology such as GPS units, cell phones and laptops with specialized software. Fujita had none of that. This arduous and lengthy process was then conducted in part by aerial surveys via Cessna airplanes and then drawn on maps. The process also involved sending out paper surveys asking for responses from anyone who was able to witness a tornado during the outbreak.
The documentation of the outbreak that Fujita and his team completed in the aftermath of that outbreak is legendary, said Wakimoto, who described Fujita as “incredibly meticulous.”
“And his map of that event has been widely shared and talked about. It was just an incredible effort that pretty much he oversaw by himself. With his staff, it was just amazing, for how long ago that was, it was the ’70s. It was just an amazing jump in our knowledge about tornadoes,” said Wakimoto, who previously served as the director of the National Center for Atmospheric Research.
Smith added that the mapping of the tornadoes and their intensities from the super outbreak was “an amazing accomplishment.”
“What made Ted unique was his forensic or engineering approach to meteorology,” Smith said. That approach to meteorological research is something weather science could benefit from today, Smith added.
Smith got a first-hand look at how Fujita studied storm damage nearly two decades later when they surveyed tornado damage together in Kansas.
On March 13, 1990, an F5 twister pulverized Hesston, Kansas, and surrounding areas of the state. According to the NWS, about 226 homes and 21 businesses were damaged or destroyed in the western part of town, located north of Wichita. The storm left two dead and 60 injured.
“It was a pleasure working with Ted. While I had read as many papers and books I could get my hands on, it was a step up to work with him one-on-one,” Smith said.
“Only Ted would spend dozens of hours lining up 100-plus photos of the Fargo [North Dakota] tornado to create a timeline so he could study the birth, life and death of that tornado. Ted was absolutely meticulous,” Smith added.
Fujita’s first foray into damage surveys was not related to weather, but rather the atomic bombings of Hiroshima and Nagasaki by the United States in August 1945 at the end of World War II.
He wrote in his memoir that despite the threat of lingering radiation, he traveled to both cities in September as part of a fact-finding mission for his college. At both ground zero sites, Fujita specifically studied the effects of the massive shock wave of the bomb and the height of the fireball.
“I visited Nagasaki first, then Hiroshima to witness, among other things, the effects of the shock wave on trees and structures,” Fujita said in his memoir.
In the mid-1970s, Wakimoto was searching for a graduate school to advance his meteorology studies and the University of Chicago was among his finalists. After flying out to explore the campus and city, as well as meeting with Fujita, Wakimoto knew it was the school for him.
“He was great,” Wakimoto said of Fujita the teacher. “For those that never got a chance to interact with him, he was just a wonderful person, full of energy, full of ideas. Somewhat nonstandard, and I think that came out in the PBS documentary [Mr. Tornado]. He looked at things differently, questioned things.”
Wakimoto arrived in Chicago two years after the super outbreak occurred, and while Fujita was still heavily involved in tornado research, he was also beginning to ramp up his interest in a different type of severe weather. And the research couldn’t have been more timely
The U.S. aviation industry had been plagued by a series of deadly plane crashes during the 1960s and 1970s, but the exact cause of some of the crashes was puzzling. Planes were mysteriously falling out of the sky, and the cause was often attributed to pilot error.
One of those accidents occurred in June 1975 when Eastern Airlines Flight 66 crashed as it was coming in for a landing at John F. Kennedy International Airport in New York City, killing more than 100 onboard. But other planes had landed without incident before and after Flight 66. Fujita was called on to help try to explain if the weather had played a role. And in fact, it had, but it would only become apparent to Fujita exactly what had happened.
For Fujita, this would be another opportunity to put on his detective cap. According to a University of Chicago news article, Fujita interviewed pilots of a plane that had landed at JFK just before Flight 66 crashed, as well as studied radar images and flight records.

Fujita had already been theorizing about a unique type of downburst known as “microbursts” after he had noticed a peculiar “starburst”-like damage pattern in a field while conducting a storm survey years earlier. According to the National Weather Service, “microbursts are localized columns of sinking air within a thunderstorm that are less than or equal to 2.5 miles in diameter.” This phenomenon can often produce damage that’s similar in severity to a tornado, but the damage pattern can be much different.
These strong, quick bursts or drafts of wind can alter the course of an airplane, particularly when it’s embarking on takeoff or coming in for a landing.

The broader meteorological community was skeptical of Fujita’s microburst theory, and there were a lot of arguments about his ideas. According to Wakimoto, skeptics said Fujita was essentially making up a phenomenon and just redefining the thunderstorm downdraft.
“I noticed he was a little more troubled about that push back,” Wakimoto said.
In an effort to quell the doubts, Fujita, with the help of a grant from the National Science Foundation (NSF), began a quest to document visual proof of microburst.
In the spring and summer of 1978, Fujita led a field research project in the Chicago area, along with the National Center for Atmospheric Research, known as the Northern Illinois Meteorological Research on Downburst project (NIMROD). According to the NSF, Fujita used three doppler radars because NCAR researchers had noted they were effective at finding air motions within storms. Fujita’s hypothesis would finally become a reality when the presence of a microburst was observed on radar on May 29. By the time NIMROD was completed on June 30, about 50 microbursts had been observed.
Fujita was proven correct.
The discovery and acceptance of microbursts, as well as improved forecasting technologies for wind shear, would dramatically improve flight safety. Within several years, pilots would begin to be trained on flying through such disturbances. Fujita’s breakthrough helped drop the number of aviation accidents and saved many lives.
From the late 1960s to 1980s, downbursts were the number one cause of fatal jetliner crashes in the U.S., according to Smith.
“While Ted was known as ‘Mr. Tornado,’ I consider his most important discovery to be the downburst/microburst,” Smith said.

AccuWeather Senior Meteorologist Dan Kottlowski studied meteorology at Purdue University in West Lafayette, Ind., about two hours southeast of Chicago. Kottlowski said by the time he was in school studying the weather in the early 1970s, Fujita was already a “star” in the field of meteorology.
Whenever a major severe weather event would unfold, such as the 1974 outbreak, Kottlowski and his classmates would witness Fujita’s theories come true.
“I consider him, and most people do, the father of tornado research,” Kottlowski said. “Nobody thought there would be multiple vortices in a tornado but there are. There are small swirls within tornadoes. That’s what helps explain why damage is so funky in a tornado.”
In addition to the scale and the microburst discovery, Fujita also solved the riddle as to why in the aftermath of a tornado, some homes would be damaged more severely than others. Through his field research, he identified that tornadoes could have multiple vortices, also called suction vortices, another discovery that initially prompted pushback from the broader meteorological community.

Kottlowski, who has issued weather forecasts for AccuWeather for more than four decades, said he still maintains several copies of Fujita’s initial publications and that he still reads through them on occasion.
“His knowledge of understanding tornadoes and understanding wind shear, that will be his legacy forever,” he said. “Just incredible.”
Fujita worked at the University of Chicago for his entire career, and Wakimoto said he thought that was partly out of loyalty that Fujita felt since the school helped give him his shot. The response letter from Byers to Fujita in 1951 was described by Fujita in his memoir as “the most important letter I received in my life.”
Fujita conducted research seemingly 24/7. Even when he became ill late in his life, Fujita never lost the spirit to analyze and explore the weather. An obituary published by the University of Chicago said that Fujita continued his work despite being bedridden. He passed away on Nov. 19, 1998, at the age of 78 at his home in the Chicago area.
More than two decades since his death, Fujita’s impact on the field of meteorology remains strong, according to Wakimoto.
“Even though he’s been gone now for just over 20 years, people still remember his name and do so with a lot of respect,” Wakimoto said. “So I think he would be very happy. Because sometimes after you pass away, people slowly forget who you are, but his legacy is so strong, that it’s been kinda nice to know that people still refer to him and cite him, and many had wished they had met him. I think he would’ve been thrilled.”
Produced in association with AccuWeather.
Want next-level safety, ad-free? Unlock advanced, hyperlocal severe weather alerts when you subscribe to Premium+ on the AccuWeather app. AccuWeather Alerts™ are prompted by our expert meteorologists who monitor and analyze dangerous weather risks 24/7 to keep you and your family safer.
Edited by Richard Pretorius and Matthew B. Hall

